**This video is for demonstration purposes only and is not a recommendation to buy or sell any particular
financial instrument. There is risk of loss trading Stocks, Futures, Forex, or Options.
Commitment of Traders Software Plug-in
Commitment of Traders (COT) Provides Valuable Information
- Tells you what groups are buying and what groups are selling
- Know exactly what the large & small speculators are trading
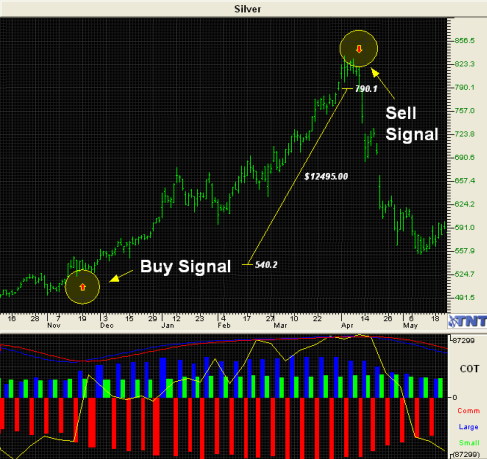
- Represented on the chart with an easy-to-read histogram customizable buy/sell signals
See how following the large speculators could be helpful?
There is the risk of loss when trading stocks, futures & forex. Past performance
is not necessarily indicative of future results.
- Blue – Large Speculators
These are the professional money managers, banks and hedge funds. Many believe following the so called “smart money” helps to identify market direction due to the large volume of their trades - Red – Commercial Traders
These are the farmers and factories who are naturally long the physical products. Typically commercials sell into a rise in price to hedge their products. - Green – Small Speculators
These are typically individual traders who trade their own accounts.
Keep Track of Large Order Volume
- See what the large professional traders are trading.
- COT customizable Buy/Sell Indicator gives insight into volume direction.
- Up to 10+ years of historical data to evaluate the effectiveness of COT signals**
- Can be used with both Track \’n Trade\’s Live Futures Trading Platform and End-of-day Futures Charting Software.
Large speculators tend to predict major movements, why not follow them?**
There is the risk of loss when trading stocks, futures & forex. Past performance
is not necessarily indicative of future results.
COT Customizable Buy/Sell Indicator
- Easy-to-read, color-coded histagram to show large speculators, small speculators, and commercial traders\’ cumulative positions.
- Generates buy/sell signals based on user-defined settings.
- Easily identify volume and position changes from one period to the next.
What is the Commitment of Traders (COT)
Small Speculators:

Small Speculators are considered to be the individual investors, generally traders like you and me, or what is known as the “retail trader.” Investors who trade their own money, for their own benefit.
- Small Speculators within in the Track ‘n Trade COT Plug-in are indicated below the chart in the default color of green.
- In this chart example, you can see the number of small speculators who are both long and short are represented directly below the actual price chart.
- In this particular view, you can see how many traders are long, (bright green above the zero line.) against how many are trading short, (darker green below the zero line.).
Large Speculators:

Large Speculators are generally banks and hedge fund managers, and are usually doing this type of investing using other peoples money, but the nice thing is, that their goal is exactly as is ours, to profit from large moves in the market.
- Large Speculators within in the Track ‘n Trade COT Plug-in are indicated below the chart in the default color of blue.
- In this chart example, you can see the number of large speculators who are both long and short are represented directly below the actual price chart.
- In this particular view, you can see how many large specs are long, (bright blue above the zero line.) against those trading short, (dark blue below the zero line.)
Commercial Traders:

Large Commercial Traders are generally producers such as farmers, or large factories. The confusing part about the large speculators, is that we don’t really know their full intention., why they are long, or why they are short. They generally have different motives than we do as speculators.
- Notice that there are actually more short positions during this obvious up-trend than their are long positions.
- The Commercials within in the Track ‘n Trade COT Plug-in are indicated below the chart in the default color of red.
- In this particular view, you can see how many large specs are long, (bright red above the zero line.) against those trading short, (dark red below the zero line.)
Composite View, All Three:

Large Commercials, indicated in red, large speculators, indicated in blue, and small speculators indicated in green.
- With this view, the histogram has been set to display both longs and shorts of each composite group; allowing you to see which markets have larger holdings on the short side of the market than the long side.
- Track ‘n Trade’s COT Plug-in also gives you the ability to turn on proprietary, user definable and customizable buy/sell signals, which can be traded manually, or using our Autopilot system.
- In the chart panel, you can also see historical price averages displayed as an overlay directly over the chart itself. Where was the market and what was the average over the past two, three, four years back or more!